AQ-SPEC Sensors Dashboard


 Very Unhealthy
 Unhealthy
 Unhealthy for Sensitive Groups
 Moderate
 Good
Good Not Available
List of Communities
AB 617
AQ-SPEC Sensor Deployments
Sensor Dashboards
External Dashboard Links
AQ-SPEC Project information
Educational Materials and Outreach Projects
Frequently Asked Questions
Sensor Networks
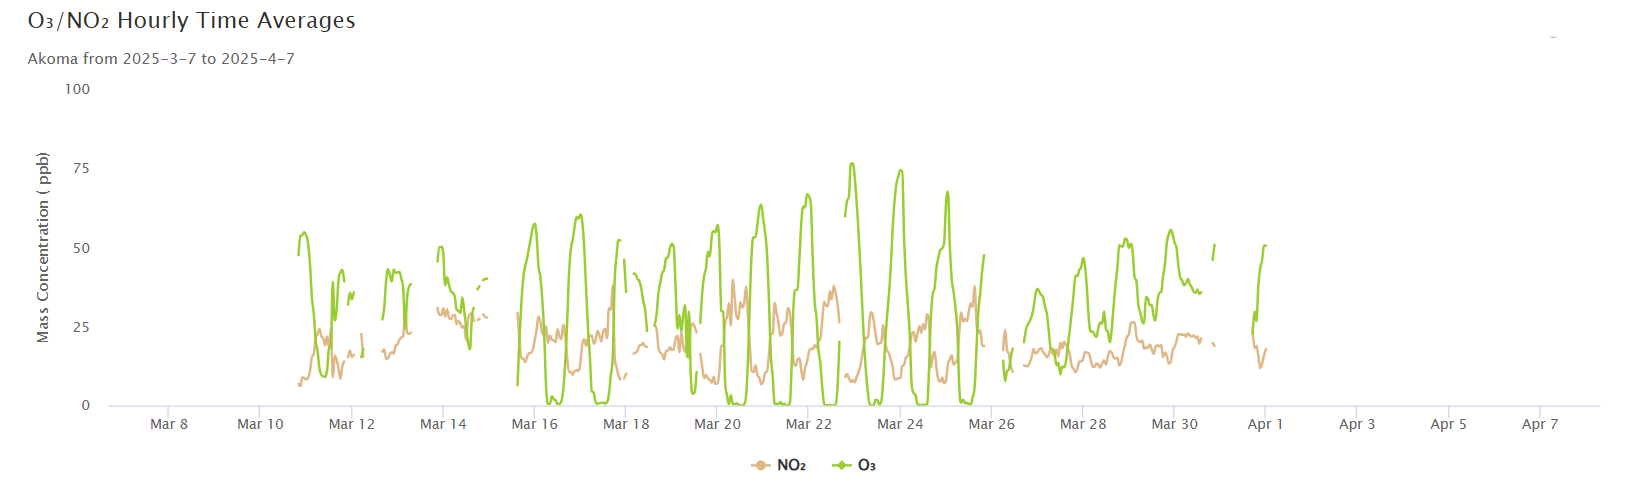
Networks of air quality sensors can help answer questions about air quality in your community. Several of these networks have been deployed in AB 617 communities using Aeroqual AQY 1.0 sensor units deployed by community members. These are multi-pollutant sensors that measure ozone, nitrogen dioxide, and particulate matter. The data collected by the AQY v1.0 sensor network is streamed into the Aeroqual Cloud system. Once there, the data is retrieved and monitored through applications that detect potential drift and potential sensor health issues. In addition, a monthly calibration is performed on the AQY v1.0 sensor network using the Aeroqual MOment MAtching (MOMA) calibration approach to calibrate the sensor units to a selected proxy reference site.
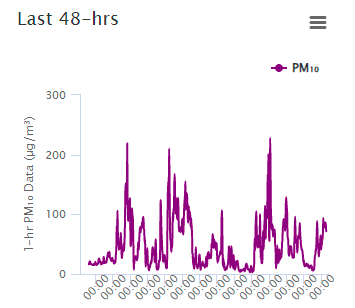
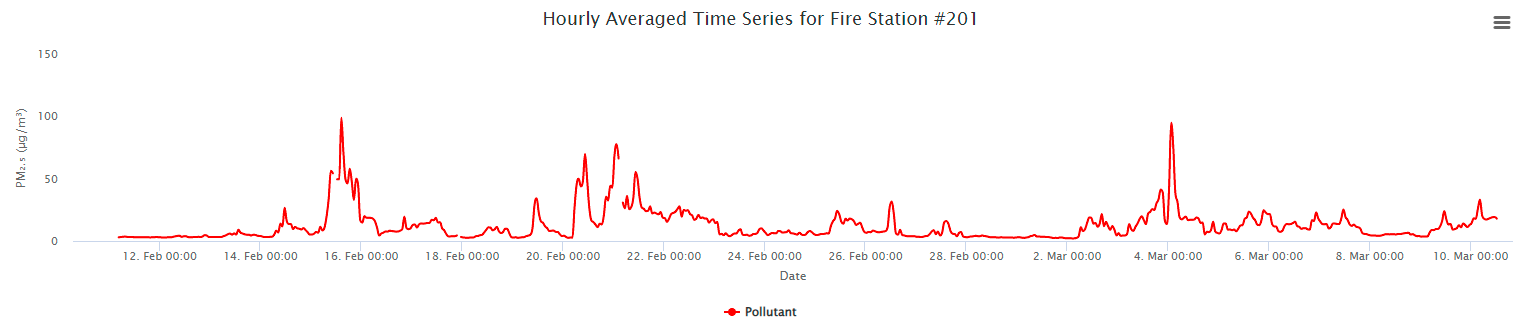
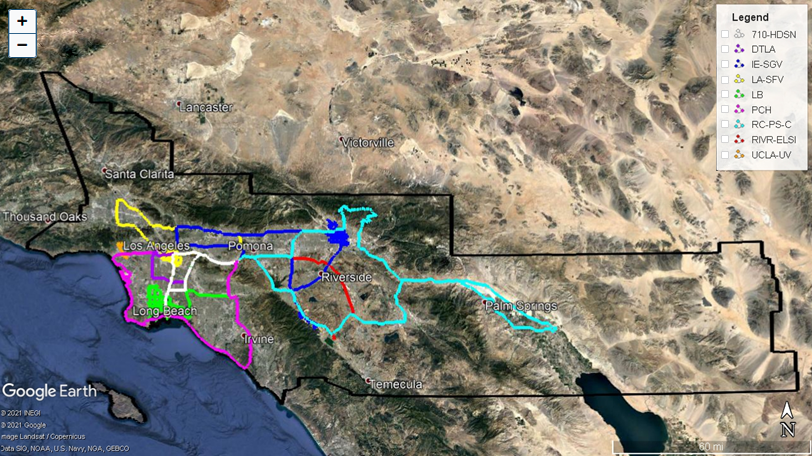
Once the data is processed as described above, it is retrieved by South Coast AQMD and made available in the Map and Dashboard. The Map and Dashboard provide an interactive experience to explore the quality controlled (QC’d) calibrated AQY v1.0 data collected within the community. A comprehensive User Guide that includes assistance with maps and plots as well as guiding questions to help you review the data is available at the link below entitled "Information on AQ-SPEC Aeroqual Sensor Network."
The data displayed has passed QC checks and has been calibrated, which improves the quality and reliability of the data. However, given that the data was collected using low-cost air quality sensors, it is not directly comparable to data from regulatory air monitoring stations. For this reason, the data should be used for informational and educational purposes only.
Site Types
- Community site – neighborhood: site selected by the community, not near any major sources
- Community site – sensitive receptor: site selected by the community and near a school, health care facility, or similar site where there are likely to be sensitive or vulnerable populations
- Community site – near source: site selected by the community and near a potential emissions source, such as a major roadway or industrial facility
- Air monitoring site - area: regulatory air monitoring station intended to collect data representative of a large population (these types of sites are intentionally located away from sources)
- Air monitoring site - near source: regulatory monitoring station located near a source of emissions
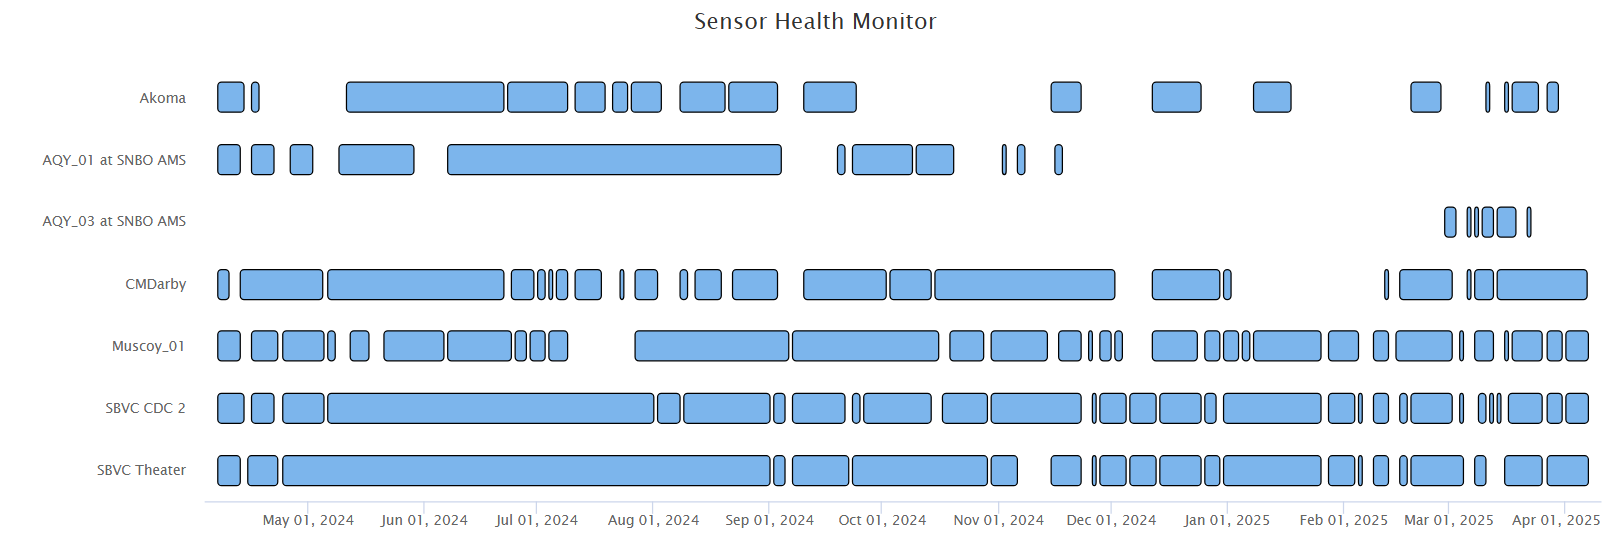
Site Descriptions
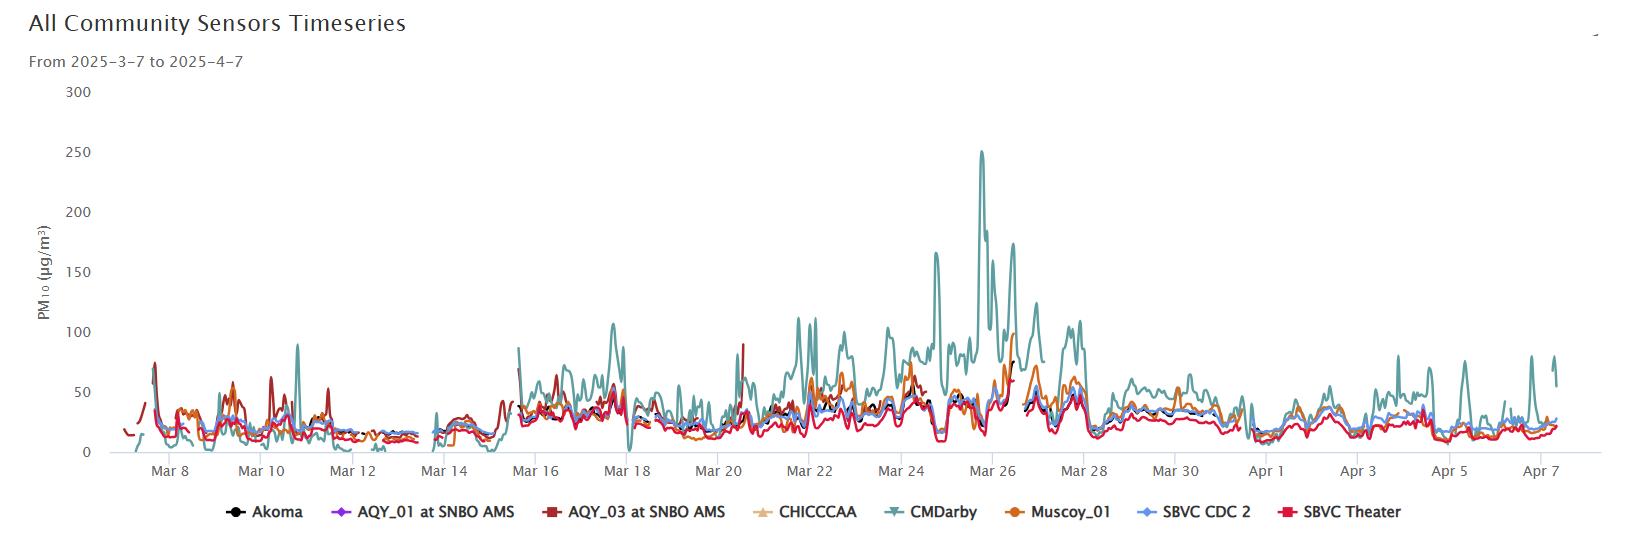
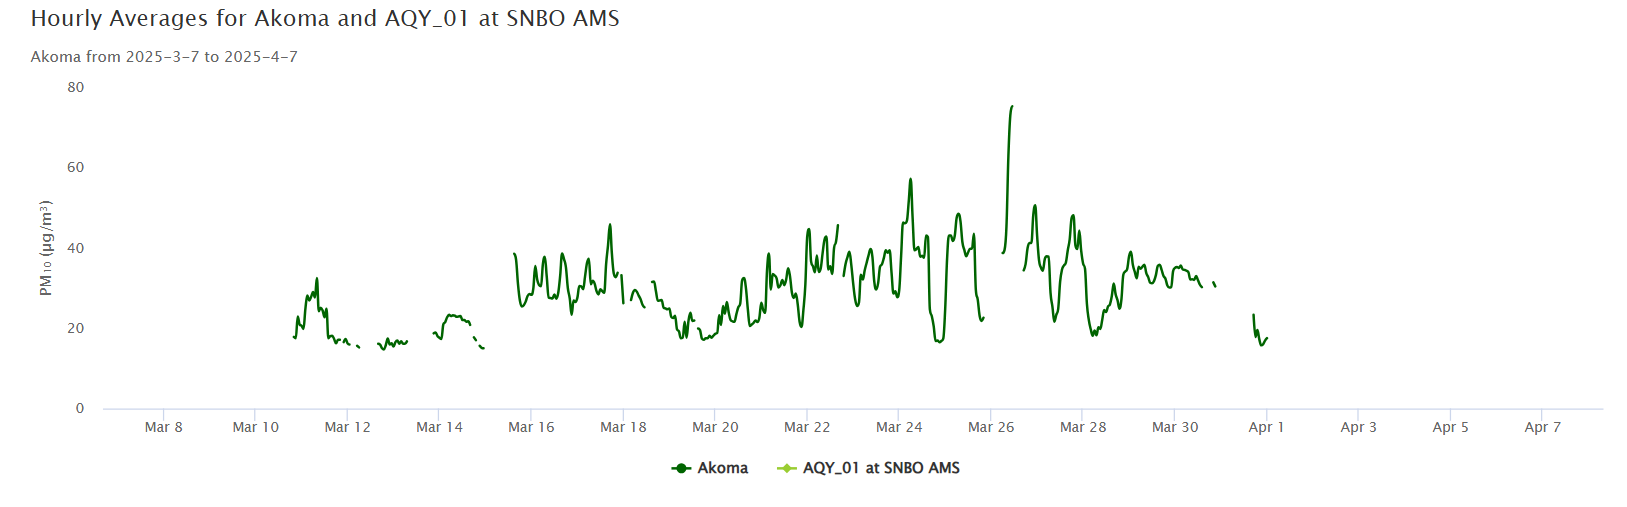
- AQY_01 at SNBO AMS: South Coast AQMD regulatory air monitoring station, unit is mounted on a pole attached to a sampling platform. Site type considered to be air monitoring site - area.
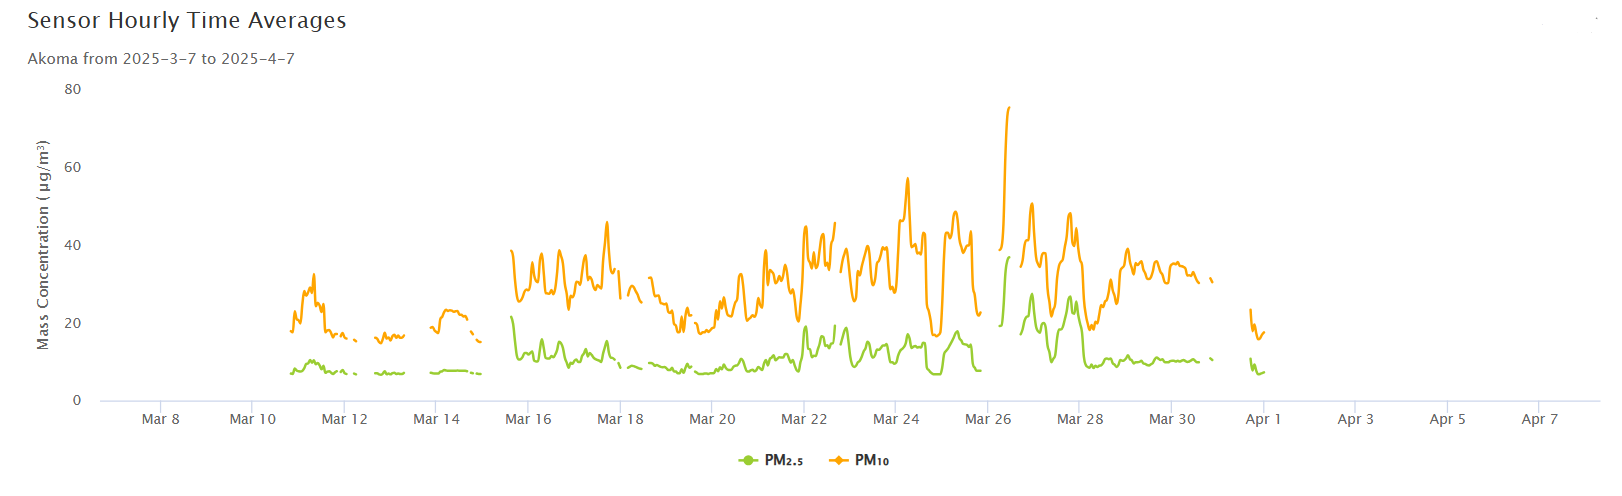
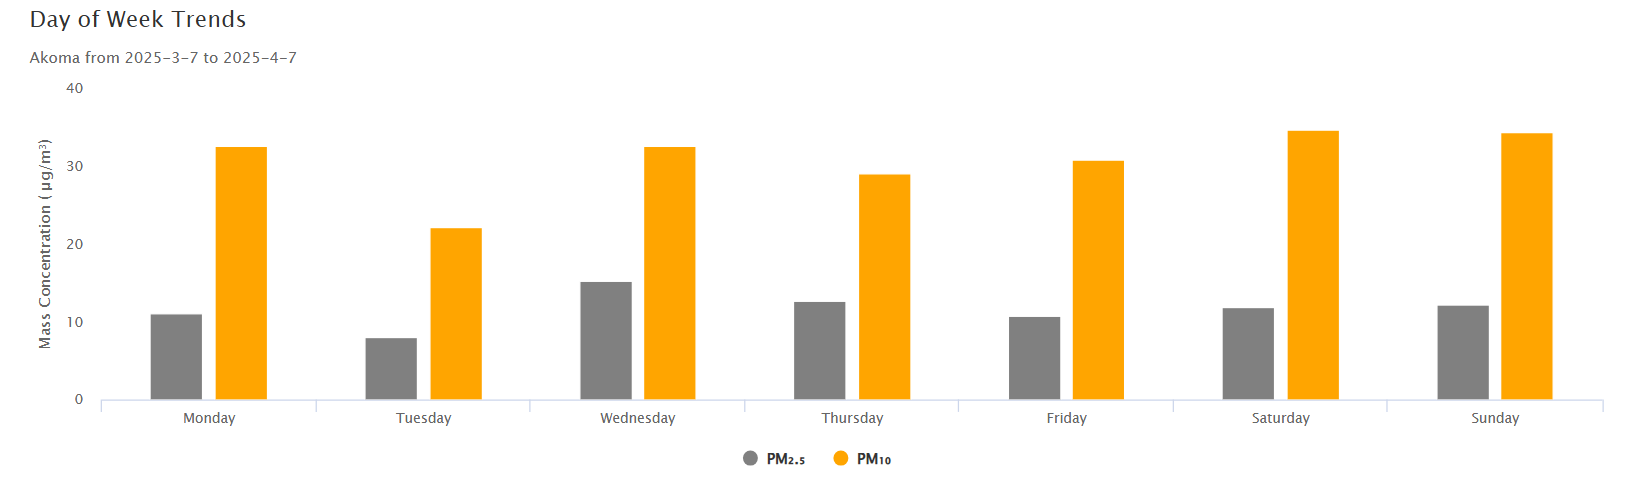
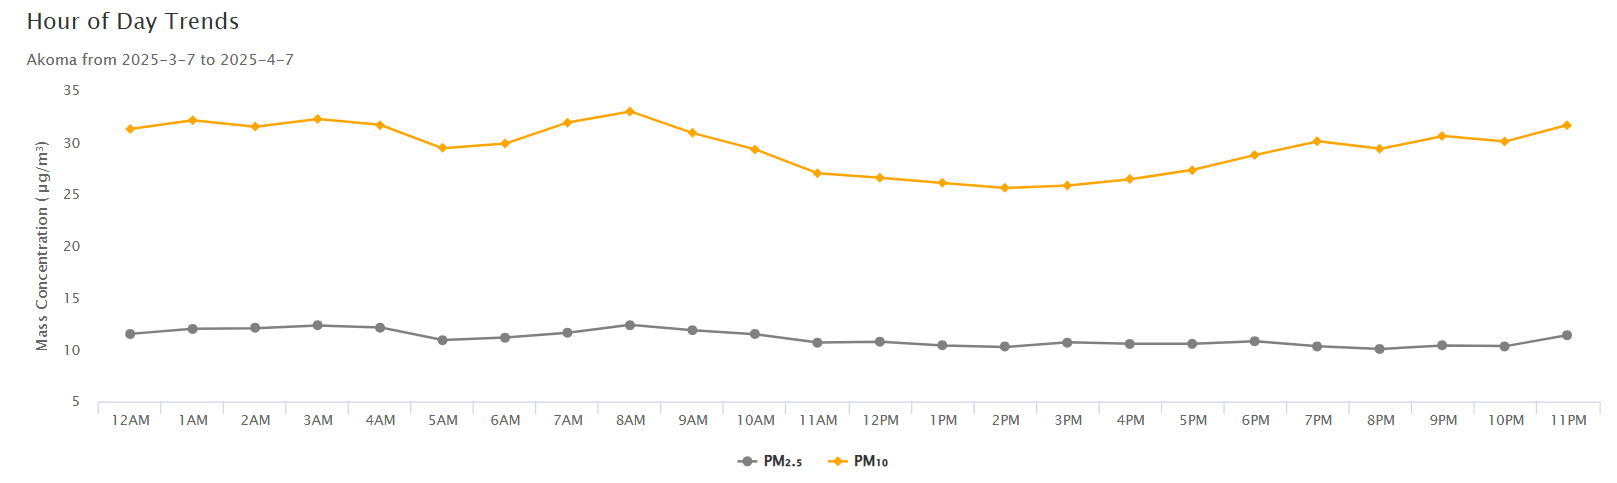
- Akoma: Akoma Unity Center, at a community park, potential for outdoor cooking and cigarette smoke. Site type considered to be community site – sensitive receptor.
- CHICCCAA: standalone building, sited on roof over roadway. Site type considered to be community site – near source.
- CMDarby: residence, in close proximity to area with heavy train traffic. Site type considered to be community site – near source.
- Muscoy_01: residence, no major sources nearby. Site type considered to be community site – neighborhood.
- SBVC Theater: San Bernardino Valley College Greek Theater building roof, installed near outdoor seating. Site type considered to be community site – neighborhood.
- SBVC CDC: San Bernardino Valley College Child Development Center, sited on building roof. Site type considered to be community site – sensitive receptor.
Important Links
More on the Color Scales
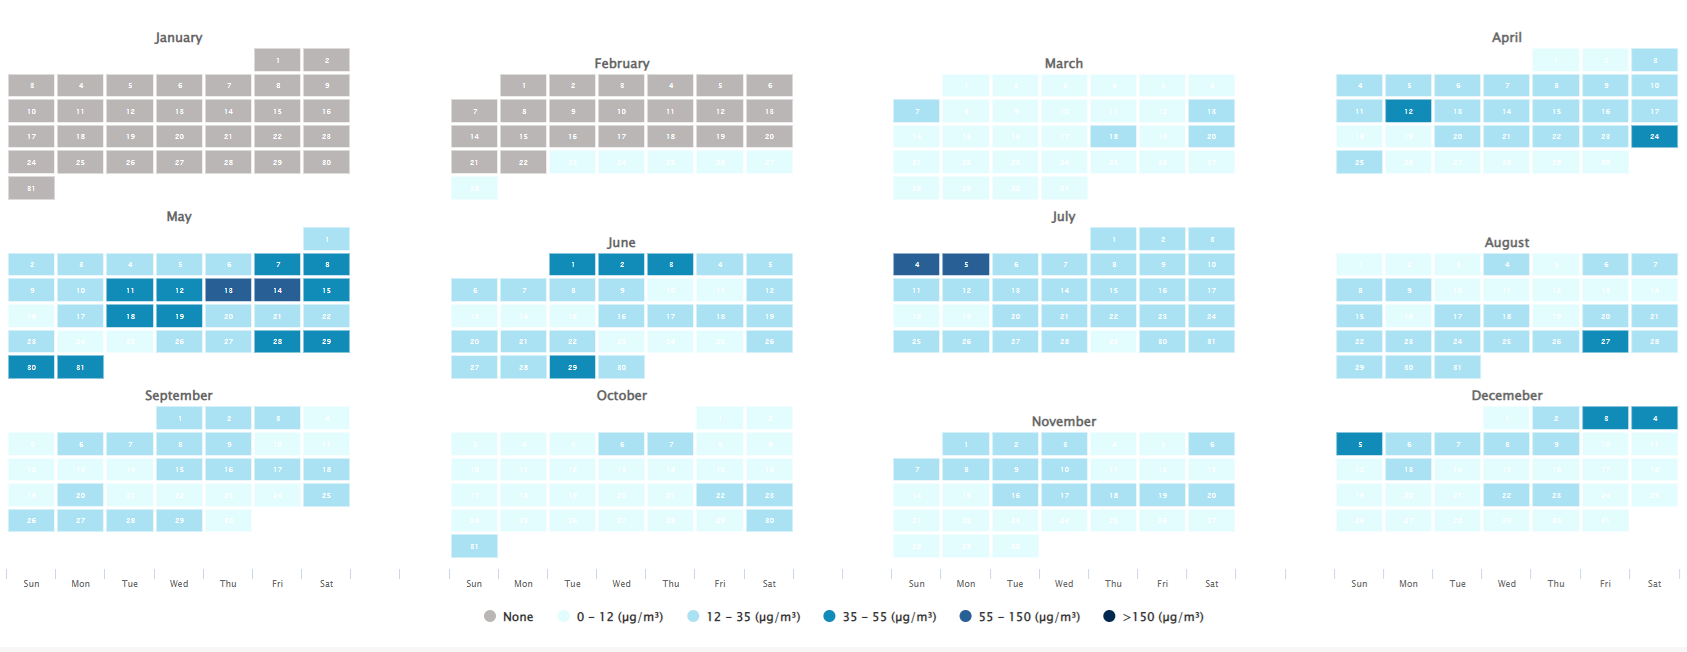
The table below lists the limits that define the color scale for each pollutant. This color scale is intended to illustrate relative differences in pollutant levels, and the limits are not associated with any public health recommendations. The color scale limits are the same for all time averages (10-minute, 1-hour, and 24-hour) shown. For O3, the highest rolling 8-hr average value from the 24-hour period selected is used in place of an actual 24-hour average. This difference in approach is based on the typical daily trends associated with this pollutant.
| # | PM2.5(µg/m3) | PM10(µg/m3) | O3 (ppb) | NO2 (ppb) |
|---|---|---|---|---|
| 1 | 0 - 12 | 0 - 50 | 0 - 30 | 0 - 35 |
| 2 | 12 - 35 | 50 - 100 | 30 - 60 | 35 - 70 |
| 3 | 35 - 55 | 100 - 150 | 60 - 90 | 70 - 100 |
| 4 | 55 - 150 | 150 - 200 | 90 - 120 | 100 - 120 |
| 5 | >150 | >200 | >120 | >120 |
Disclaimer
The AQY v1.0 sensor network and related tools are intended to be used for educational and informational purposes. Furthermore, the code used to build these tools, the data processing steps, and the different features of these tools may be subject to revision depending on the needs of the project. The data collected by the AQY v1.0 sensor network is from air quality sensors that are processed and calibrated to improve the accuracy of the sensors. These sensors are not regulatory-grade instruments and should be used for informational purposes only.
Contact
Please feel free to reach out to the AQ-SPEC group at the South Coast AQMD with questions or comments related to the San Bernardino AQY sensor network or the Map and Dashboard Tool.
- Website: http://www.aqmd.gov/aq-spec/contact
- Phone: +1 (909) 396-2713
- e-mail: info.aq-spec@aqmd.gov